We’re catching up on the summer market with a look back at June and July and a peek at how August is shaping up so far. These numbers reflect resale homes—existing single-family properties in Boise city limits—and show how 2025 stacks up against recent summers.
Real Estate market stats are interesting. As agents, we receive market updates from our local association and we follow stats from the National Association of Realtors. These stats often lump together new construction with existing homes. Also, local stats are often for Ada County as a whole and not Boise specifically.
I like to understand the Boise market, so I export data each month from our MLS and then analyze it in Excel, creating my own graphs. I’m looking at all single family homes, excluding new construction, on lots less than half an acre. That is, the most typical resale properties in Boise.
Right now there is a lot of talk about the market softening. Anecdotally, I would agree that a lot of us “felt” this in the market response for listings that hit the market in the June and July timeframe. But a closer look at data for Boise resale shows July was the strongest month for closings of the past three years. What did happen is that new listings surged in May and June that triggered an increase in days on market–buyers took more time to consider their options. But we also saw a jump in pending sales and closings, so buyers didn’t pull back as much as they took their time before making a decision.
List-to-Sold Price Ratios Dipped then Rose
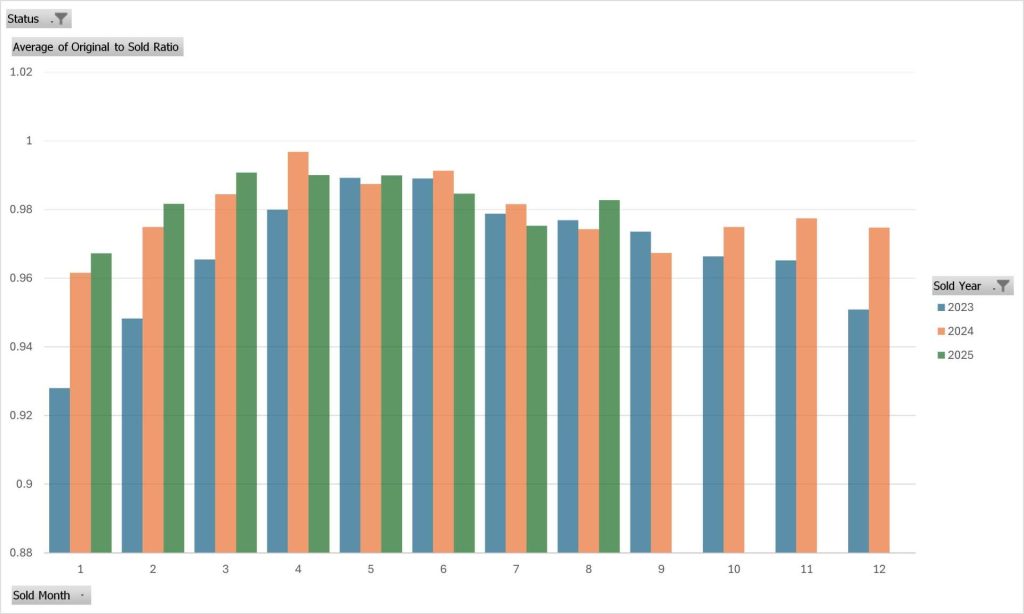
As our inventory increased late Spring, buyers negotiated more with sellers, resulting in a list-to-sold price ratio that was lower in June and July as compared to past years. Now, this number has still been around 97% of asking–a strong number overall. But on average, sellers negotiated down on pricing more in May and June than past years.
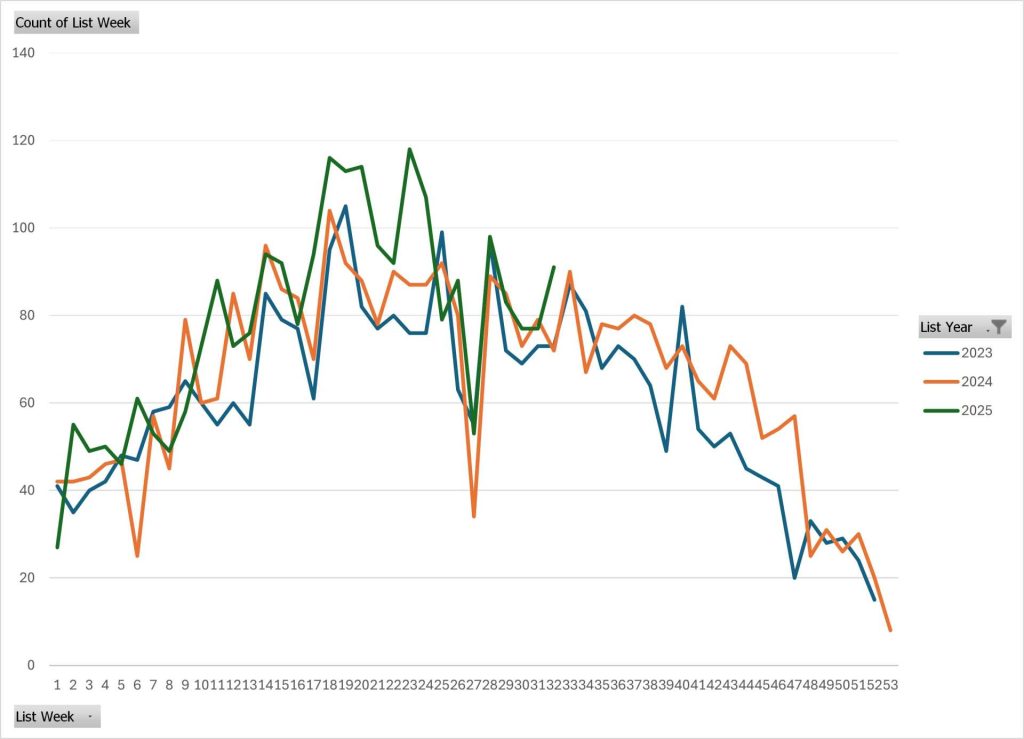
For closings so far in August, list to sold prices have been higher. The next graphic explains that. This shows the count of new listings by week. As you can see, 2025 has largely tracked 2024 and 2023 but in the May/June timeframe, new listings surged. That surge was temporary though–once we hit late June/early July, new listings normalized. Once that new inventory was absorbed, and buyers had fewer choices, list to sold prices rose.
Monthly Pending Sales – Summer Momentum
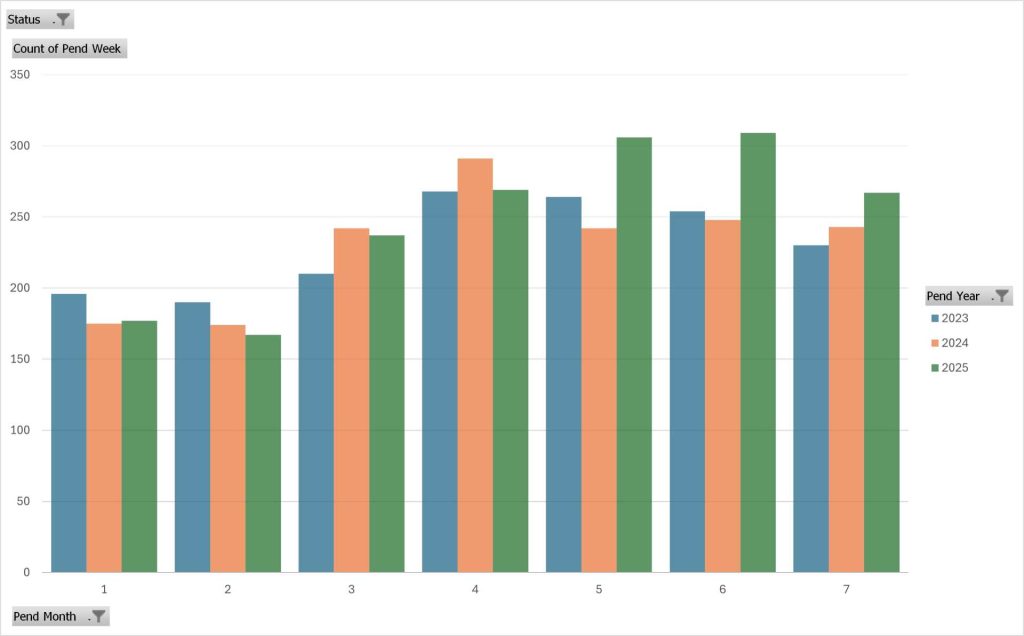
Comparing the months of June through July for the past three years, we see how pending sales in 2025 were slightly lower than the past few years from January to April and then jumped in May, June and July. This pending sales activity went hand in hand with increased listing activity. It would seem that as sellers are entering the market, buyers are there to greet them.
Weekly Pending Contract Activity
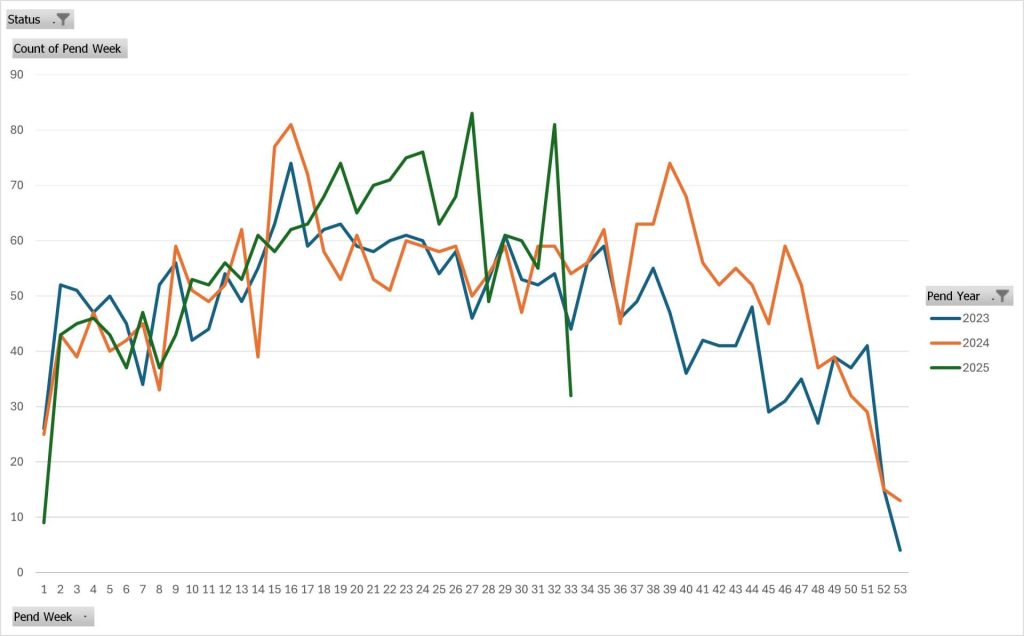
This is the count of new pending contracts by week for the entire year. Notice how this tracks with the listing week graph above. Again, note the surge in pendings in week 26 and 27, the last two weeks of June into the first days of July as buyers pinned down homes before the July 4 holiday. June exceeded expectations for pending sales, July was normal, and early August has been stronger than expected. That low point for August reflects half a week’s data during my mid-week analysis.
Closed Sales – July Outshines Recent Summers
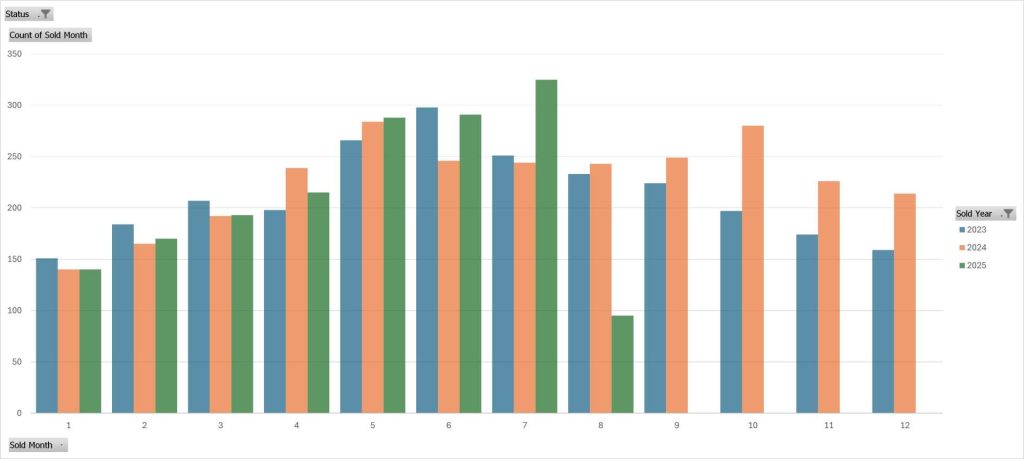
The volume of new listings and pendings in May and June brought a three-year high for number of residential resale closings in July. However, looking back at sales volume for the month of July in 2020, 2021 and 2022 (not pictured), we still have a ways go go in terms of overall sales volume–we are well below past years before interest rates rose.
Home Prices Holding Firm
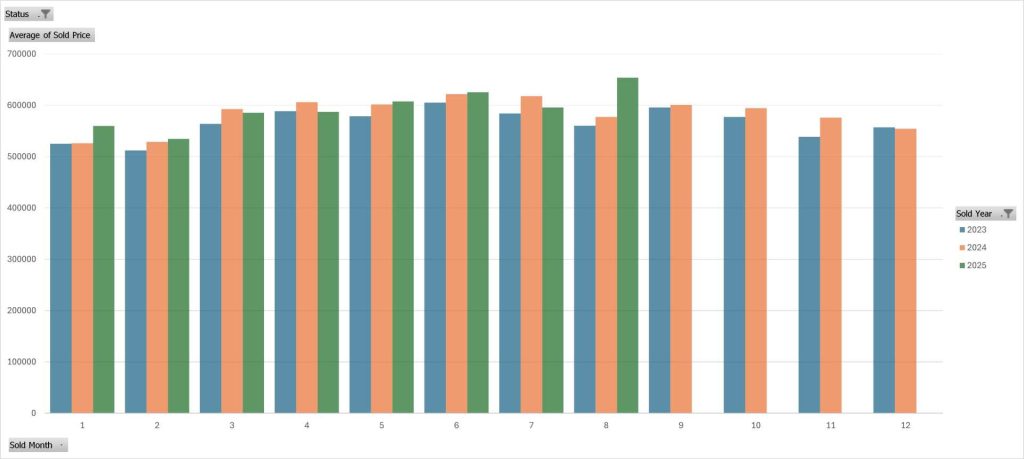
The average sold price in June was slightly above the average price for 2024 while July average sold price was slightly below 2024. Again, this is a reflection of that lower list-to-sold price ratio mentioned above–buyers negotiated more with sellers with more options in the marketplace.
Overall, pricing the past few years has not varied dramatically. August, so far, however, shows a jump in average sold price. I would normally expect to see sold prices peak for closings in June and then fall for the rest of the year so the August bump so far this month is an outlier. We have a lot of homes yet to close in August as closings tend to skew towards month-end so this is likely timing and not a trend. Still, I’ll be watching this closely. I have experienced years with strong August sales and pricing and those years were followed by a hot fall market.
Price Per Square Foot – A Steady Climb
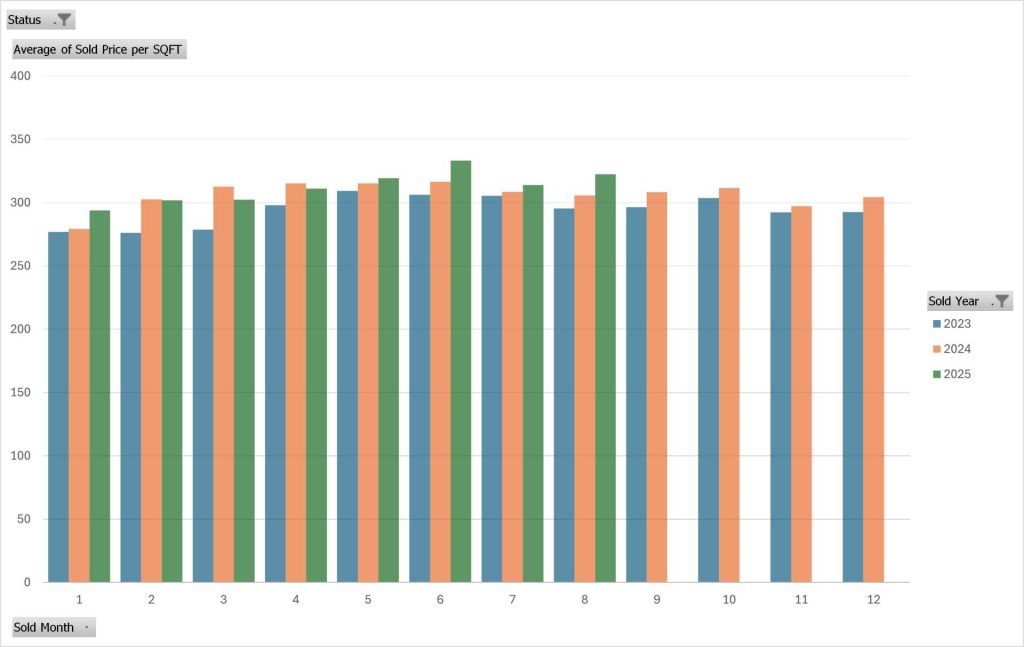
Price-per-square-foot numbers have stayed impressively consistent this summer, with June hitting a three-year high and July and August remaining strong. Many homeowners may be seeing bar-setting sales in their neighborhoods.
Days on Market
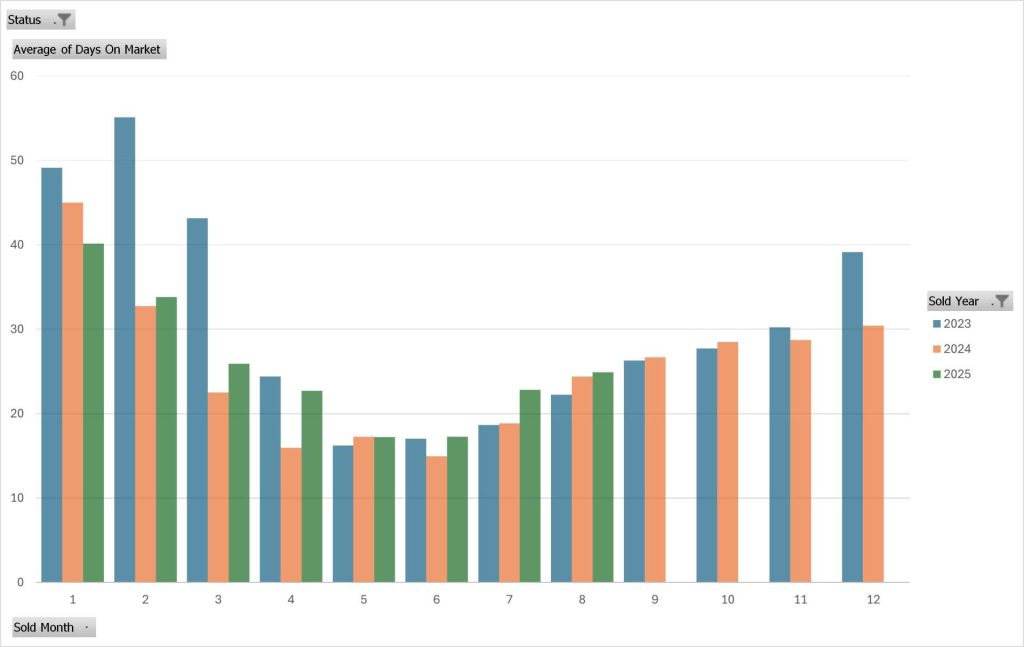
Homes sold in June and July sold quickly and sellers have enjoyed relatively short market times. July average days on market was higher than expected and seems to be a reflection of the inventory surge in May and June and buyers taking a bit more time to make decisions.
Listing Outcomes – More Choices for Buyers
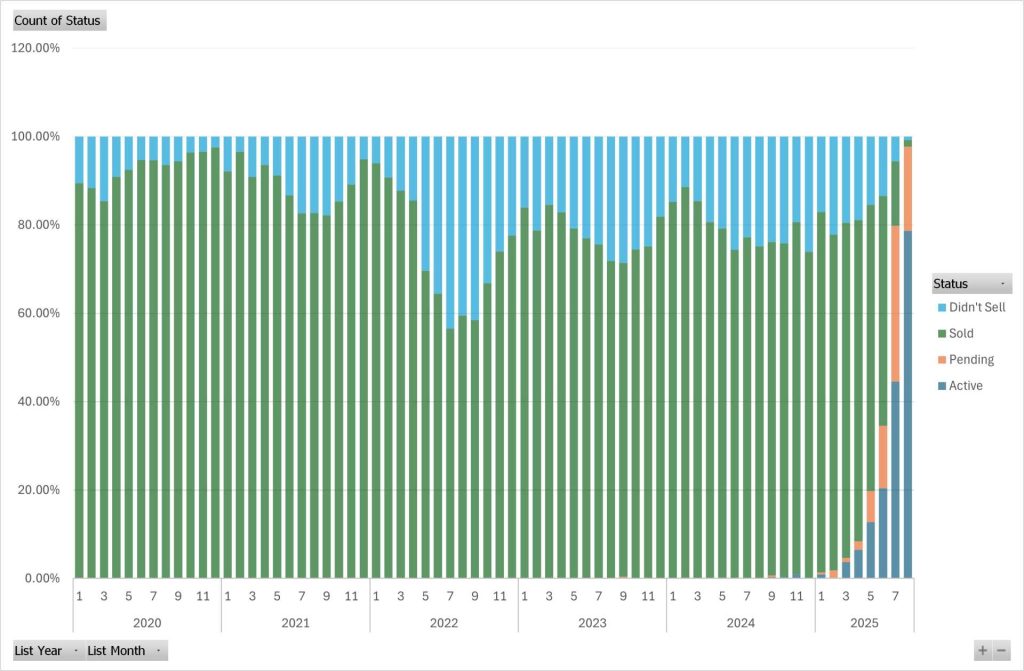
Despite dozens of news stories lately about record numbers of sellers pulling their homes from the market, this isn’t true for the Boise resale market. The peak of this behavior was in the fall of 2022. This year has been similar to 2023 and 2024. Real estate is local–our Boise market is not following national trends.
The Takeaway for July/August 2025
This summer’s resale market in Boise has been stronger than the past two years, with July standing out for both sales volume and price stability. Buyers are still competing for the best homes, but they have more to choose from than in the spring. Sellers who bring their homes to market in good condition and at the right price are finding motivated buyers—often quickly.
We did see buyers negotiating on price more this summer than last, but overall sales volume is higher and it remains to be see whether this is a lasting trend or if that was a temporary shift due to inventory growth. The market overall is steady and I’m expecting a strong fall market in Boise.

 Site by Ha Media
Leave a Reply